Incidents Report
The Incidents report provides detailed metrics about the Incidents that affect your service components. On this page you will find several KPIs, visual graphs, and Tables that give you different filtered views and perspectives of your incident response.
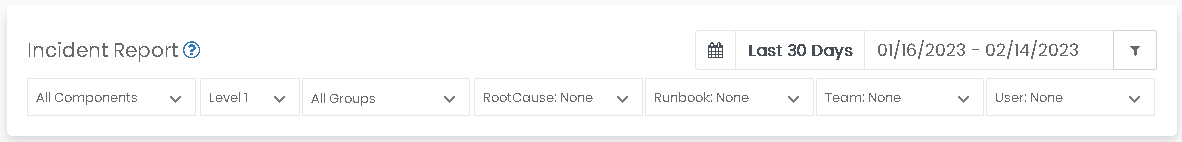
Filtering
Filters can be applied to the tables and graphs to provide views that focus on several different parameters pertaining to Incidents.
| Filter | |
|---|---|
| Components | Can filter by service component |
| Levels | Can filter service components by Parent/Child Level (Up to 5 levels) |
| Groups | Can filter by group (Graph Only) |
| Root Cause | Can filter by Root Causes |
| Runbook | Can filter by Incidents |
| Team | Can filter by assigned Team |
| User | Can filter by assigned User |
KPIs

Incident KPIs
| Metric | |
|---|---|
| Mean Time to Resolution | Displays the average time to close an incident |
| Mean Time Between Failure | Displays the average times when service components are normal between incidents |
| Total | Total number of Incidents |
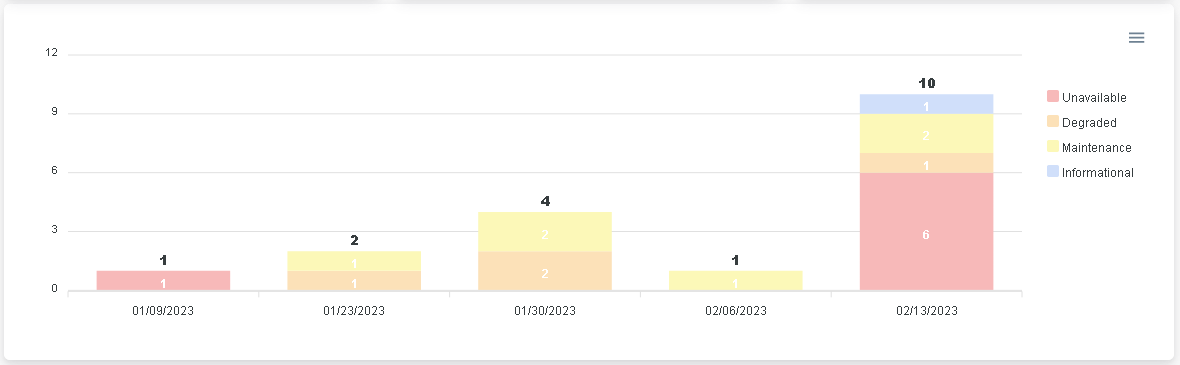
Incidents View
Displays the number of incidents that have occurred within your environment split by Incident within a given range of time.
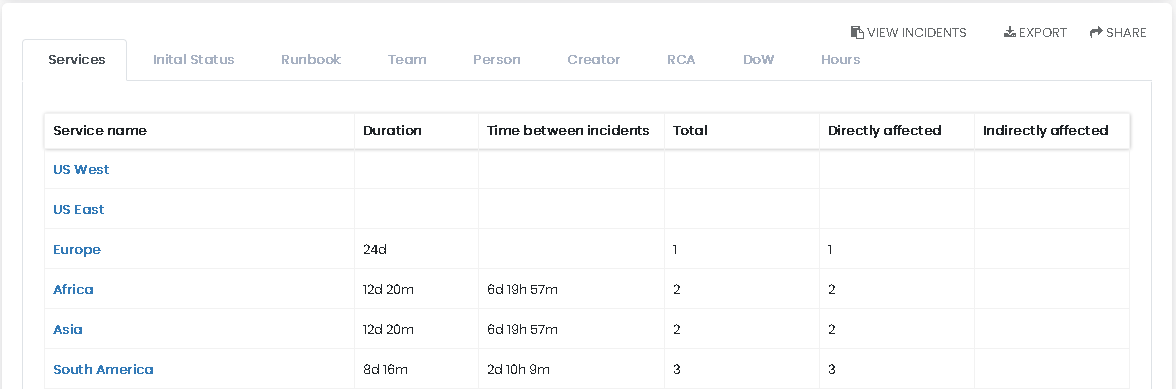
Service Components View
Displays information related to the incidents affecting Service Components in your environment
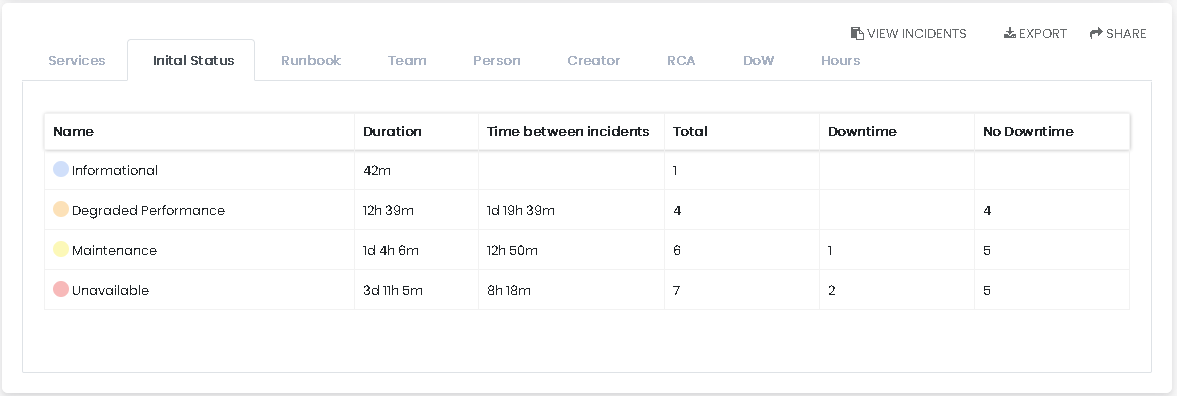
Initial Status View
Displays information related to Service Component states in your environment.
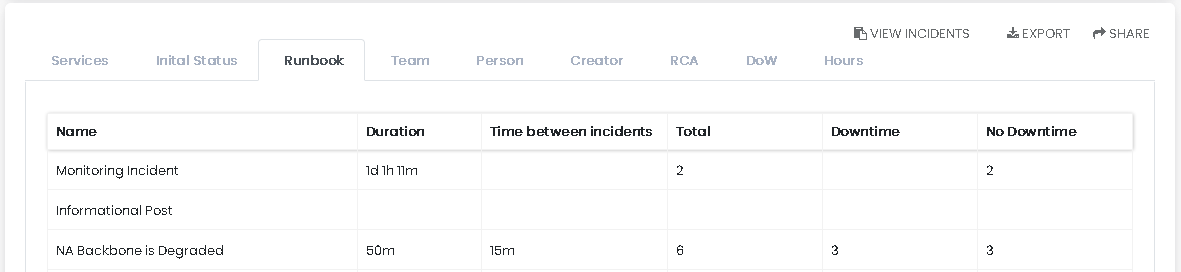
Runbook View
Displays information related to incidents created with Runbooks used in your environment.
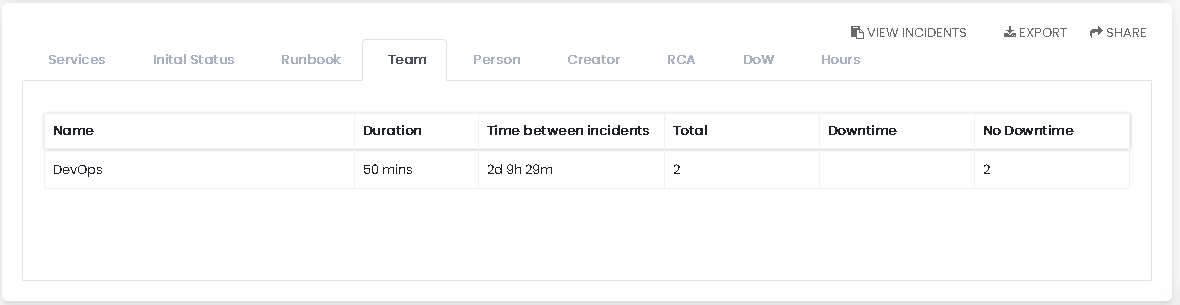
Teams View
Displays information related to incidents assigned to Teams.
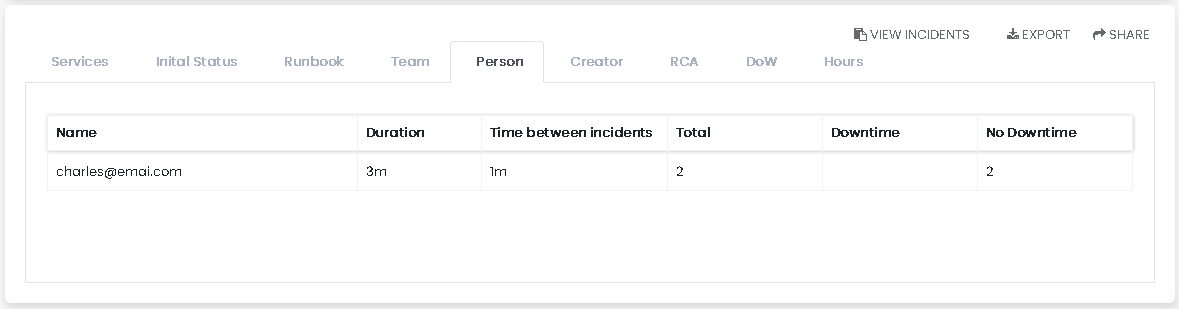
Users View
Displays information related to incidents assigned to users.
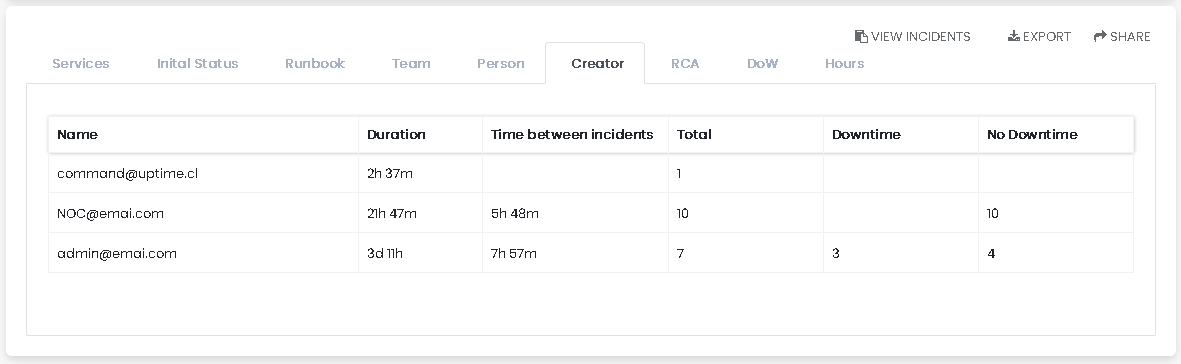
Creator View
Displays information related to incidents based on initial creator.
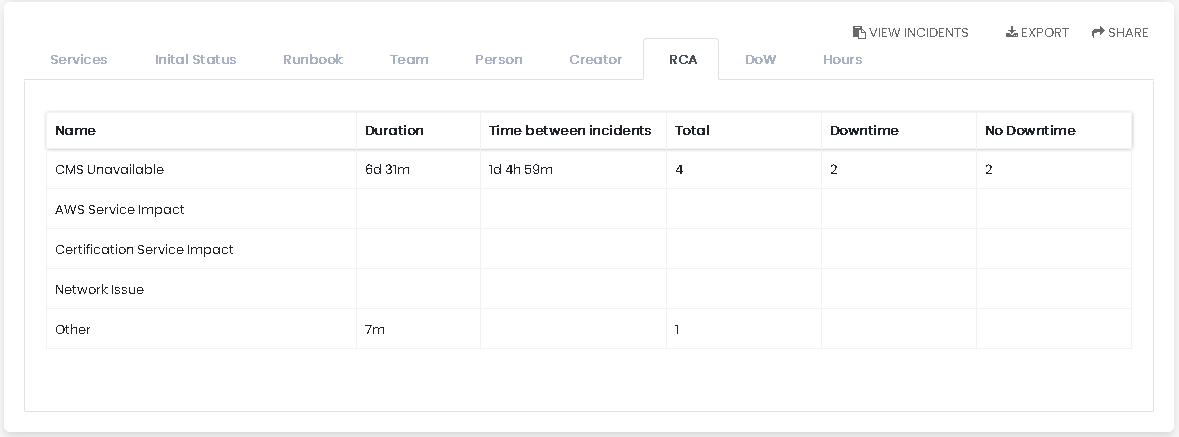
RCA View
Displays information related to Root Causes associated with your incidents. Root Causes templates can be added to your environment by following the KA located here.
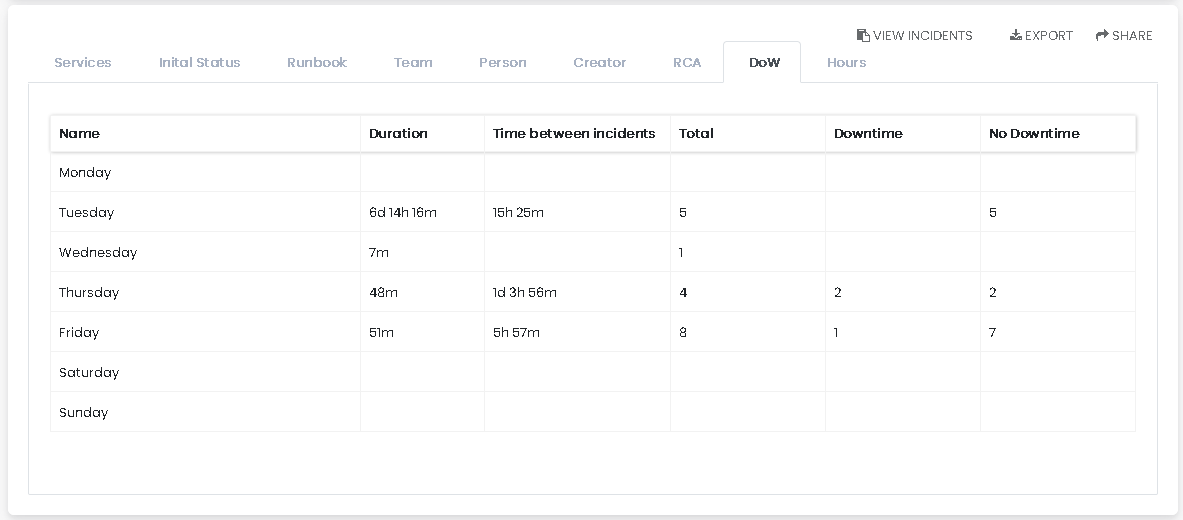
Day of Week View
Displays information showing a relationship between incident creation and day of the week.
Hour of Day View
Displays information showing a relationship between incident creation and hour of the day.
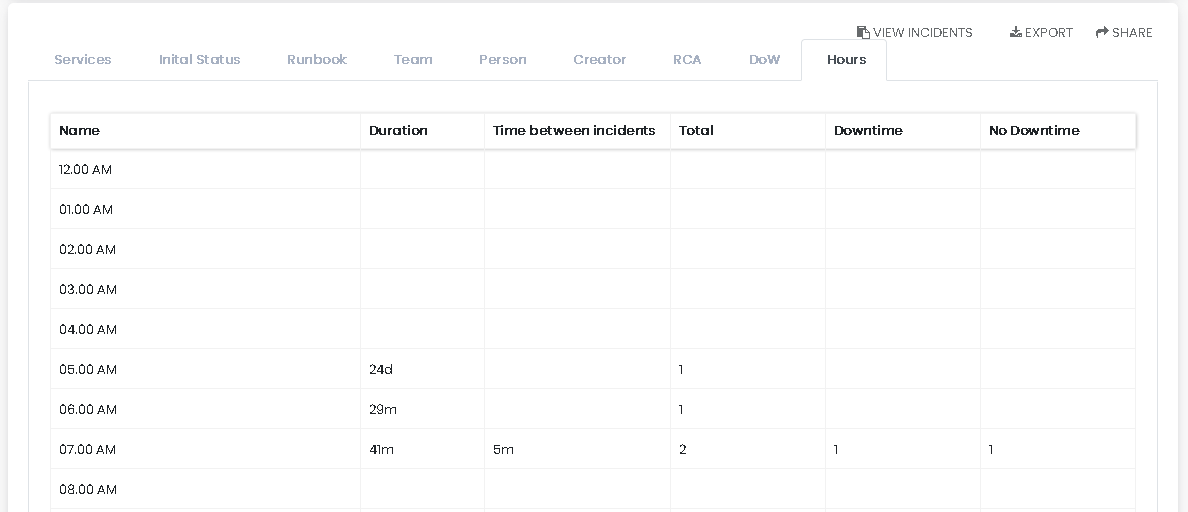
Table Paremeters
| Header | Description |
|---|---|
| Name | Title, Name, or Date |
| Duration | Duration of time in affected |
| Time Between Incidents | Duration of time between incident creations |
| Total | Total number of incidents |
| Downtime | Number of incidents that counted towards downtime |
| No Downtime | Number of Incidents that do no count towards downtime |
Updated over 1 year ago