Metrics Widget
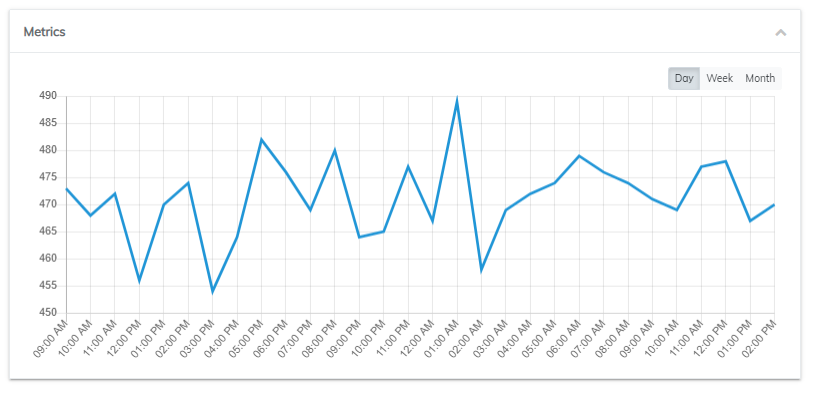
The metrics widget is very helpful in measuring the activity of the monitor(s) within your status page.

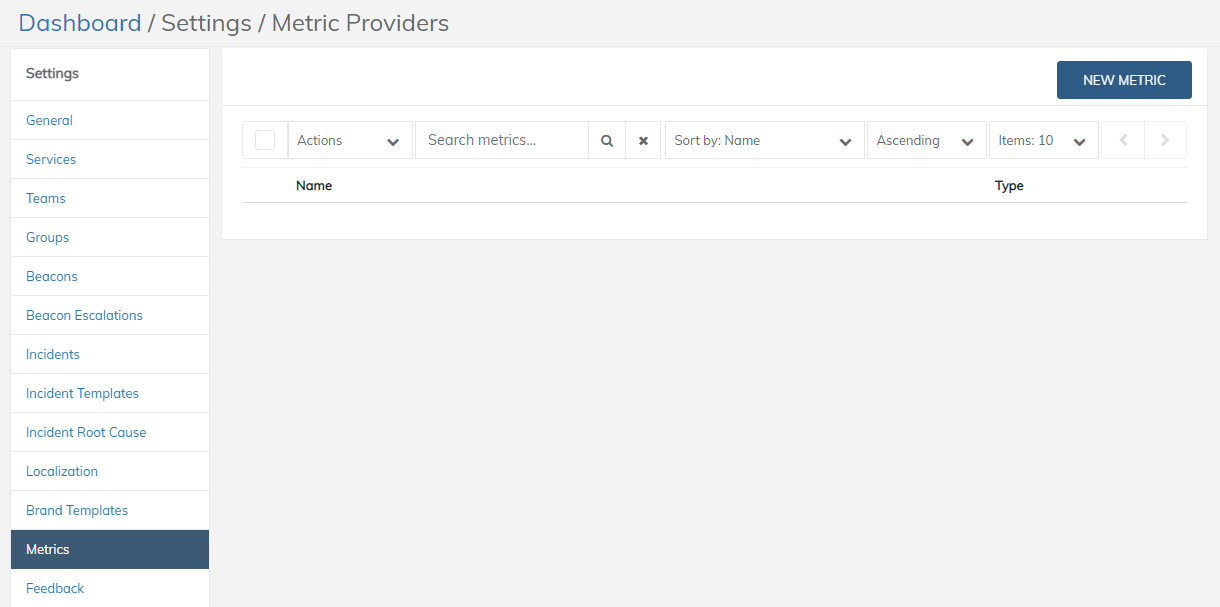
In order to get started, you would need to make sure your metrics are registered in the Metrics settings. To do so please go to Settings > Settings > Metrics. Once there you can register your integration's metrics by clicking on the New Metric button.

Then select the integration from the Type dropdown, give it a name and click the Create button.

Once the metric is registered, navigate to the widget's settings in the Page Design section. There you will be able to select them from the Metrics to display dropdown. You can then select the time range for the graph in which to render.

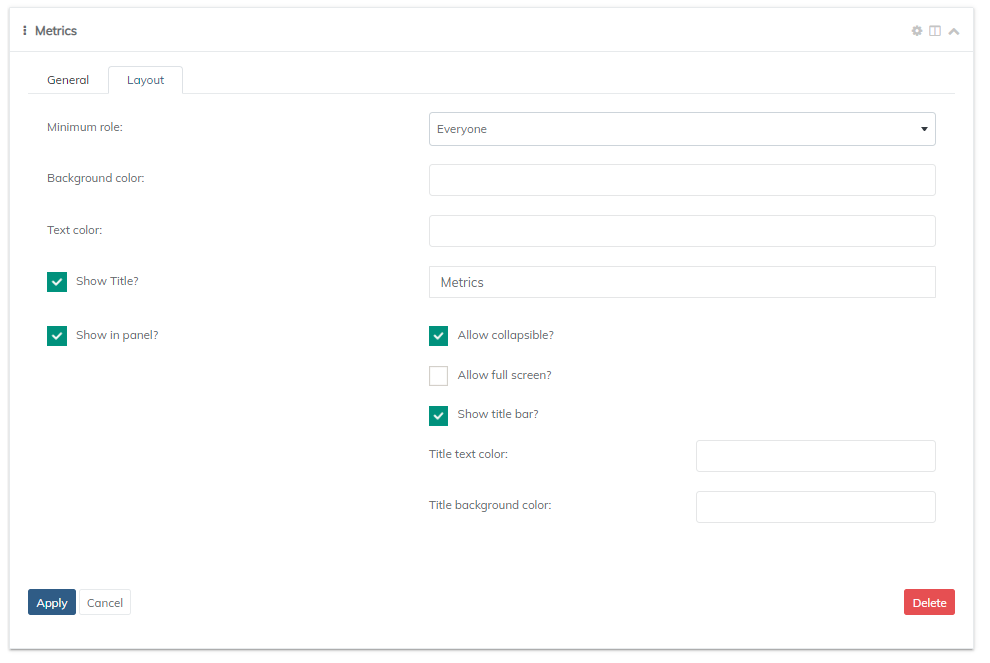
For filtering and design features, you will need to switch over to the layout tab. Here, you can define the level of visibility. Each widget will allow you to filter data depending on the role of the visitor or subscribers. The roles that are available with filtering include: Everyone, Subscriber, Employee, Manager, Administrator, and Company Administrator.

The layout tab will also allow you to edit the color of a couple things such as text, and background. This will save some time from the traditional search of elements and override with CSS.
Updated 11 months ago
