Uptime Summary
Familiarize yourself with the uptime summary widget settings
Uptime Summary
Have an uptime percentage for your status page in whole, or define some filters to have a customized uptime percentage.

Settings
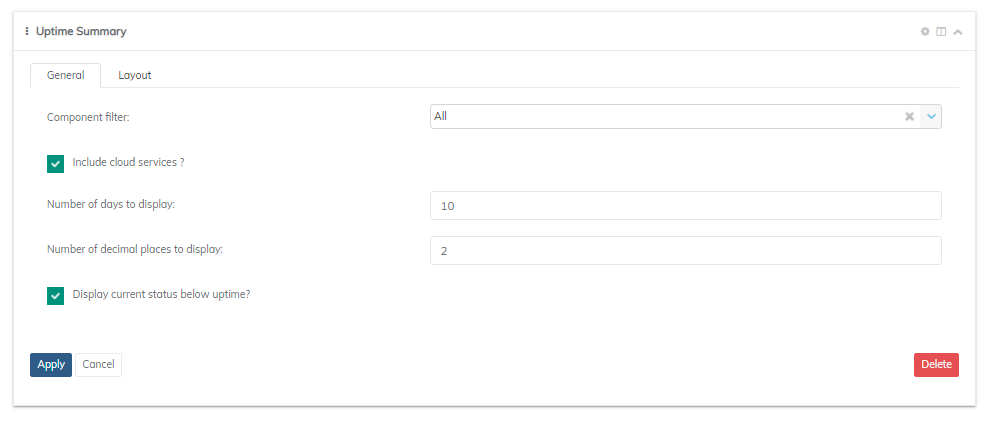
The setup for the uptime summary widget is quite simple. By default the widget will display an uptime summary of all components with a number of days to display for the last 10 days. The component filter will allow you to customize the uptime summary based on a single component rather than all components as a whole. Like the other uptime widgets, the uptime summary widget will allow you to include the cloud components integrated into your page into the uptime calculation. The number of days along with the amount of decimal places to display are all customizable to your preferences.

Filtering and Design
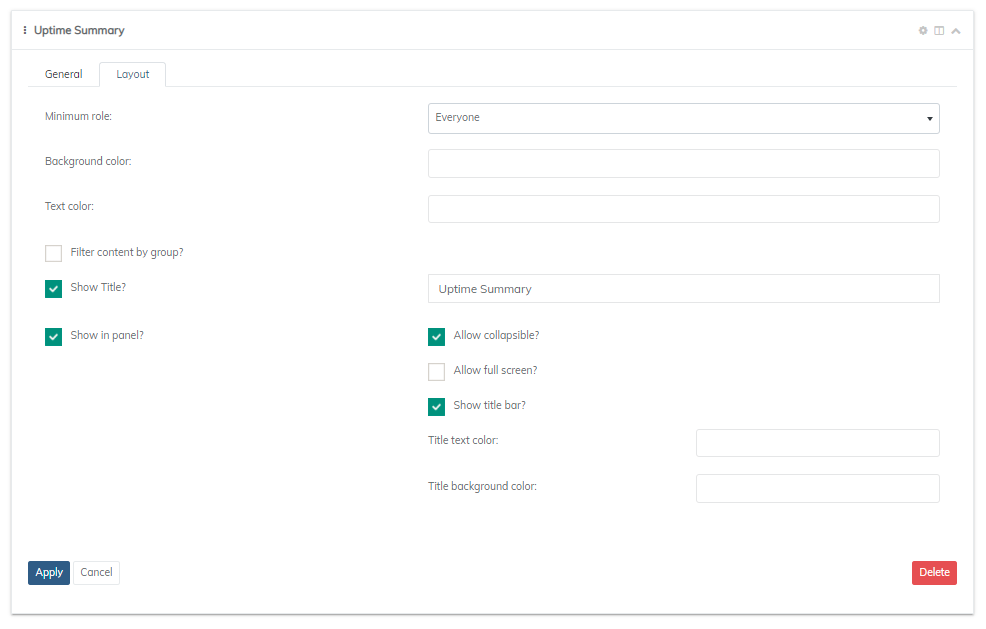
For filtering and design features, you will need to switch over to the layout tab. Here, you can define the level of visibility. Each widget will allow you to filter data depending on the role of the visitor or subscribers. The roles that are available with filtering include: Everyone, Subscriber, Employee, Manager, Administrator, and Company Administrator.

The layout tab will also allow you to edit the color of a couple things such as text, and background. This will save some time from the traditional search of elements and override with CSS.
Updated about 1 year ago
