Traffic Report
The Traffic report provides metrics on page view to your StatusCast Page. The purpose of this report is to give you an insight into the amount of traffic your page receives within a frame of time based on a selected date range.
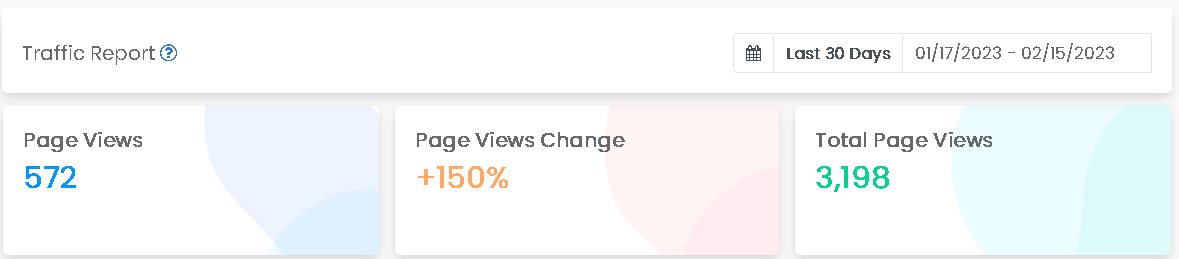
KPIs
| Metric | Description |
|---|---|
| Page Views | Displays the number of page views |
| Page Views Change | Displays the percentage of traffic change. This is produced by calculating the difference between the start and end of the date ranges selected. |
| Total Page Views | Displays the number of page views since the page creation |
Traffic View
Traffic Chart
Displays the traffic to your Status Page.

Traffic Chart
Traffic Table
Displays the page views by in a daily, weekly, or monthly view based on the set date range.

Traffic Table
Table Parameters
| Headers | Description |
|---|---|
| Period | Date |
| Count | Number of visitors |
| Total | Cumulitive number of visitors |
| Change | Percentage change of traffic from last period |
Exportable CSV
Table data are exportable into a .CSV with the following information:
- Date period
- Number of page views
- Total number of accumulated page views
- Percentage change from previous period
Updated over 1 year ago