Recent Uptime
Recent Uptime
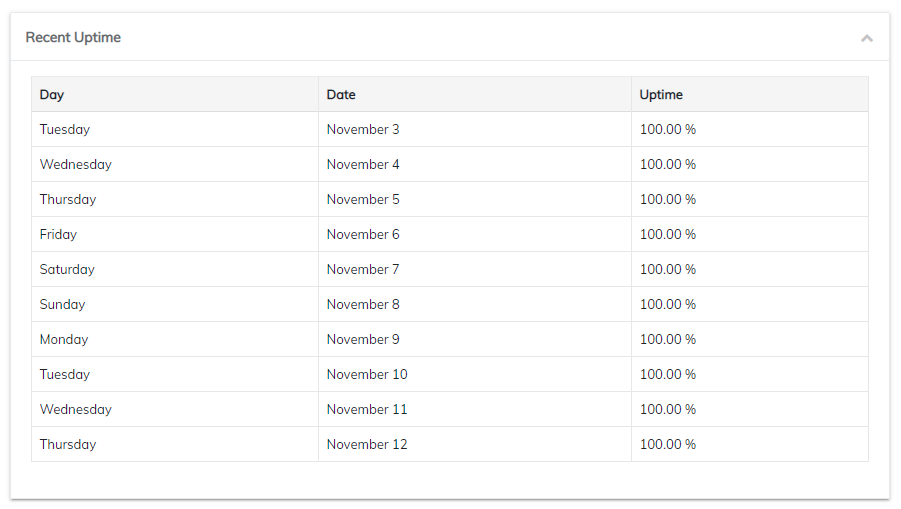
Tracking and displaying the uptime percentage for one or all of your components is made very simple with the recent uptime widget. Use filters to showcase the appropriate information for your subscribers.

Uptime Options
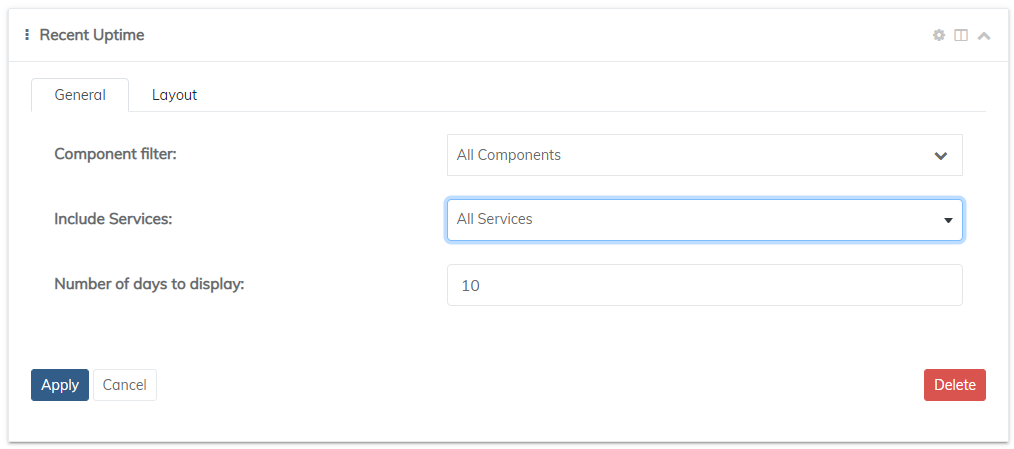
The setup for the recent uptime widget is quite simple. By default the widget will display the recent uptime of all components with a number of days to display of 10. The component filter will allow you to customize the uptime percentage based on a single component rather than all components as a whole. Choose all services, only local services, or only cloud services.

Filtering and Design
For filtering and design features, you will need to switch over to the layout tab. Here, you can define the level of visibility. Each widget will allow you to filter data depending on the role of the visitor or subscribers. The roles that are available with filtering include: Everyone, Subscriber, Employee, Manager, Administrator, and Company Administrator.

The layout tab will also allow you to edit the color of a couple things such as text, and background. This will save some time from the traditional search of elements and override with CSS.
Updated about 1 year ago
