Services Report
The Services Report provides you with information on maintenance, degraded performance and unavailable state times per service component to help you identify problematic services.
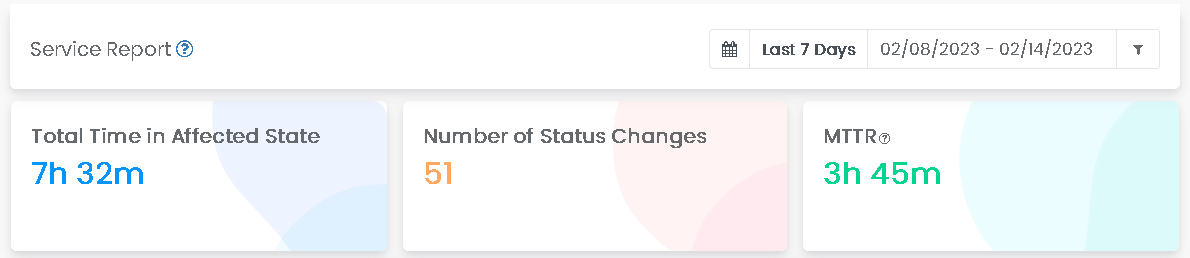
KPIs
| Metric | Description |
|---|---|
| Total Time in Affected State | Displays the total time service component(s) are in affected states |
| Number of Status Changes | Displays the number of times a state change has occurred, either by an incident or manual change, of service component(s) |
| Mean Time to Resolution | Displays the average time to restore service component(s) |
Duration View
Duration Chart
Displays a visual representation of the time the services component(s) have been affected states. Highlighting the bar gives you the duration of that state specific state.

Duration Chart
Duration Table
Displays the time spent in each state for all components.

Duration Table
Frequency View
Frequency Chart
Displays a visual representation of the number of status changes. Highlighting the line gives you the number of times the state has been entered.

Frequency Chart
Frequency Table
Displays the number of times a state was reached for all components.

Frequency Table
Table Parameters
| State | Description |
|---|---|
| Unavailable | The service component offline and inaccessible |
| Degraded | The service component is online, but performance is reduced. |
| Maintenance | The service component is undergoing maintenance |
| Identified | The service component has been identified on the server |
| Investigating | The service component is actively being researched |
| Monitoring | Service component is being monitored for any changes in status |
| Informational | An informational state used to inform an audience |
Exportable CSV
Table data are exportable into a .CSV with the following information:
- ID
- Service Component Name
- Duration in Unavailable
- Duration in Degraded
- Duration in Maintenance
- Duration in Identified
- Duration in Investigating
- Duration in Monitoring
- Duration in Informational
Updated over 1 year ago